View and export survey results
Open the survey's Options menu → View Responses & Results. At the top you'll see the total responses, valid responses, satisfaction rate and progress toward your target sample.
The result tabs
| Tab | Available for | What it shows |
|---|---|---|
| Responses Data | Every survey | The table of answers, one row per respondent |
| Analytics & Trends | Every survey | Charts per question, trends over time, demographic breakdowns |
| Comparative Crosstab | Every survey | One question against another, with chi-square |
| Academic & Reliability (Cronbach) | Academic surveys | The full statistical suite. See Academic surveys |
| HR & Performance (eNPS & IPA) | Institutional surveys | eNPS, importance-performance, departments. See Understand your results |
Responses Data
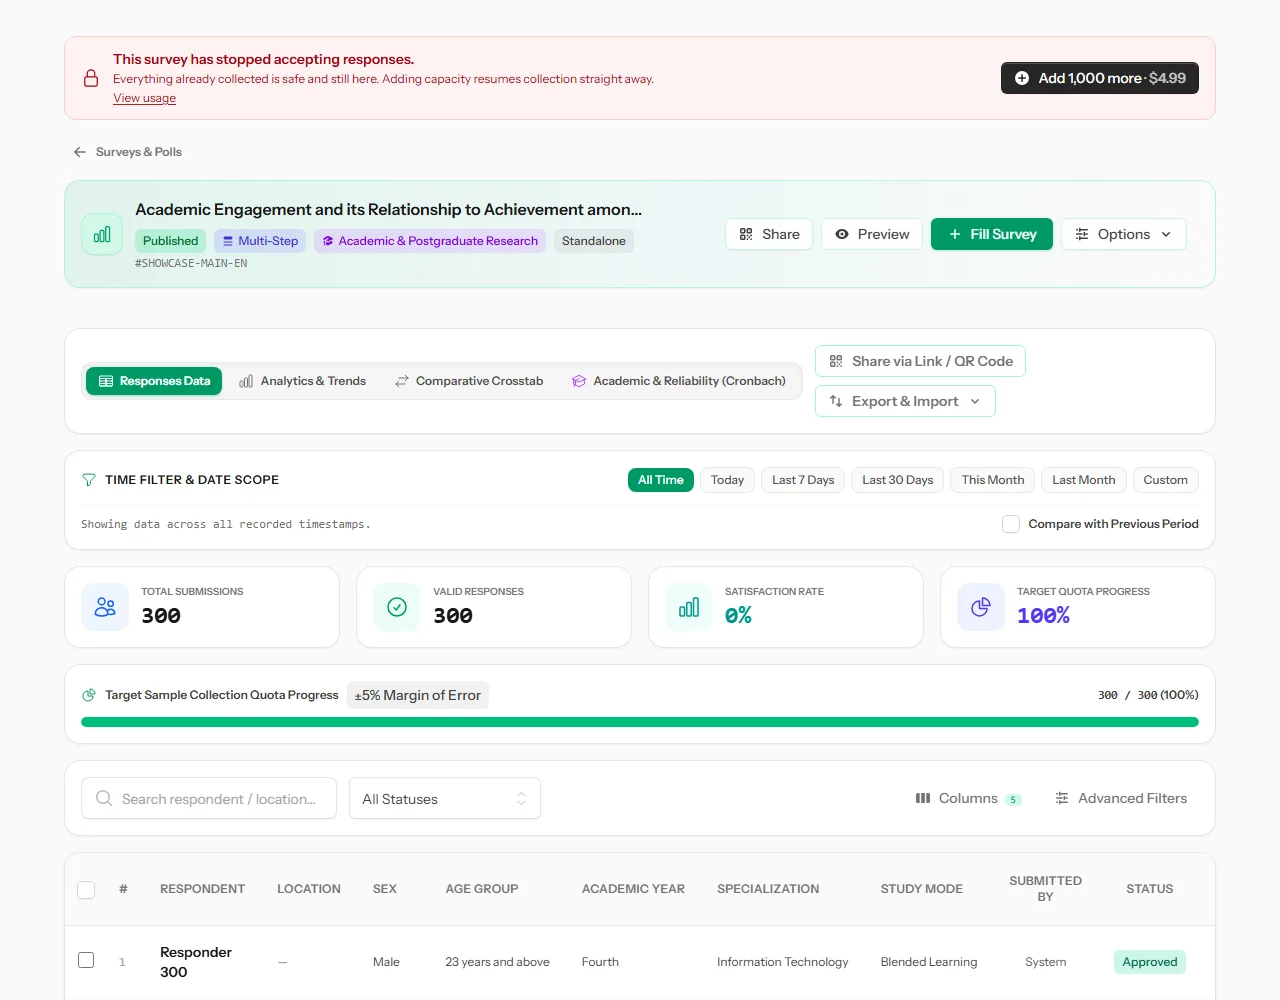
- Click a row to see the full response.
- Customize Visible Question Columns chooses which questions appear.
- Advanced Custom Filter Rules narrows the answers by any question.
- The Format check list next to the status filter can show Only records that do not match, see below.
Answers that don't fit the pattern {#format-check}
Text questions with a custom pattern are checked strictly on the public link and when importing, but not in the Collect app. A field collector's answer that doesn't fit is therefore kept and counted like any other response, and marked so you can find it:
- In a response's details, the question shows Does not match the expected format.
- Set Format check to Only records that do not match to list just those responses.
- The CSV export has a last column, Format Check, naming the questions concerned.
If you later add, change or remove a question's pattern, the marks are updated for every field-collected response of the survey.
Analytics & Trends
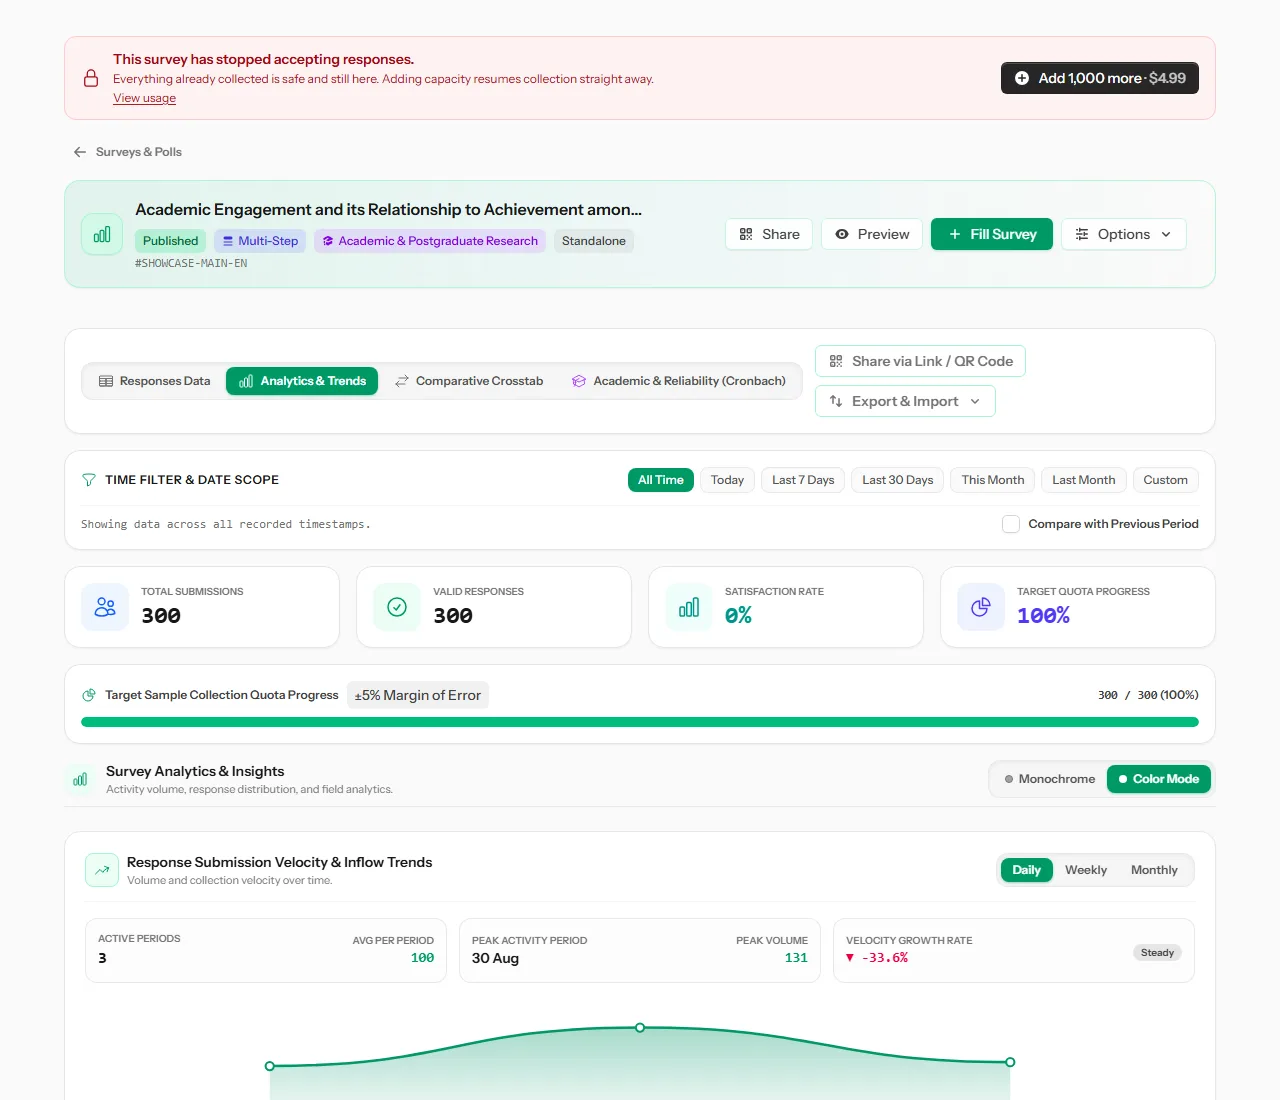 Headline figures, how fast answers are arriving, and a breakdown of every question.
Here you'll find Survey Analytics & Insights, submission trends, the Demographic Breakdown & Disaggregations (using the questions you mapped in settings), crosstabs you've pinned, and a chart for every question.
Comparative Crosstab
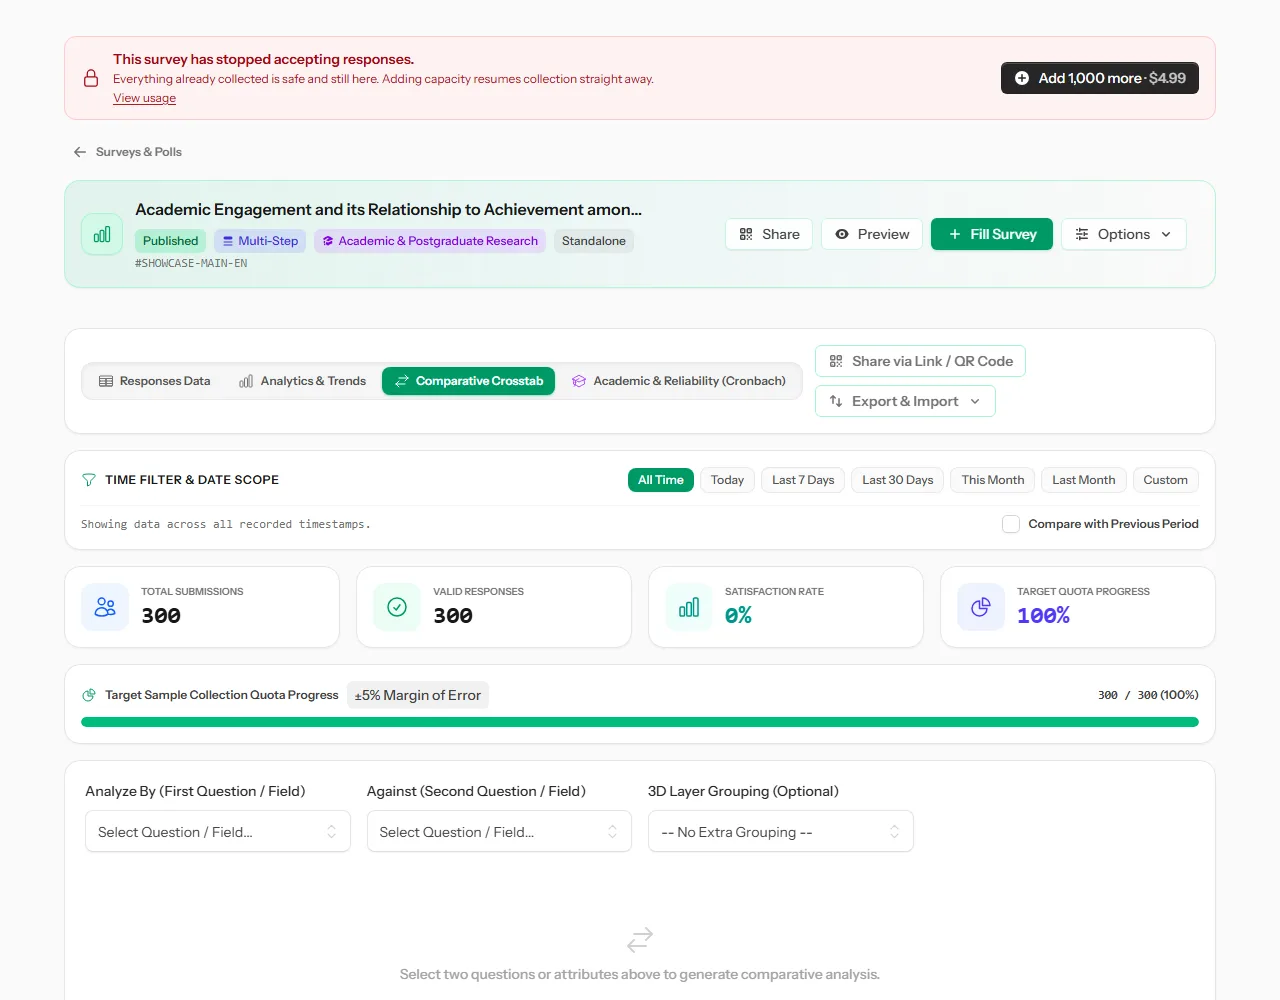
Choose a row question and a column question, such as study mode by gender. You can add a third layer question. Pulseform adds the chi-square test and Cramér's V, and warns you when the table is too sparse for the test to be trusted.
Time filter
Time Filter & Date Scope limits every tab to a period: All Time, Today, Last 7 Days, Last 30 Days, This Month, Last Month, or a custom range. Tick Compare with Previous Period to see how things changed.
Export and import
Open Export & Import:
| Option | You get |
|---|---|
| Export CSV | The answers as a spreadsheet, with a last Format Check column for answers that didn't fit a pattern |
| Export for SPSS (.csv Codebook) | A file ready for SPSS, with a codebook. Academic surveys |
| Export Analytics to PDF | The charts and analysis as a PDF |
| Import Responses (CSV) | Add answers collected on paper or in another tool |
| Download Sample CSV Template | A template with the right columns for this survey |
| Auto-sync to Indicator | Push the results to the linked monitoring indicator. Only when the survey is linked |
Share via Link / QR Code is next to it.
On academic surveys, Print Report prints the whole statistical analysis.
Warning Exports include only what's currently shown. If a filter or date range is on, the file contains only those answers.