Pre/post surveys
A pre/post study measures the same people before and after something, such as a training program or an intervention, to show whether it made a difference. Pulseform links the two surveys, matches each person's two answers, and runs the right statistical test.
How it works
| Wave | Label in the list | When |
|---|---|---|
| Pre / Baseline | The original survey | Before the program |
| Post / Endline | A linked copy of it | After the program |
The post survey is an exact copy of the pre survey, and each question stays linked to its original. So the comparison stays correct even if you later reorder or reword questions.
1. Create and collect the pre survey
Create the survey as usual, and collect the baseline answers. See Create a survey.
2. Create the post survey
- Open Surveys, and open the Options menu of the pre survey.
- Click Create Follow-up Wave (Post).
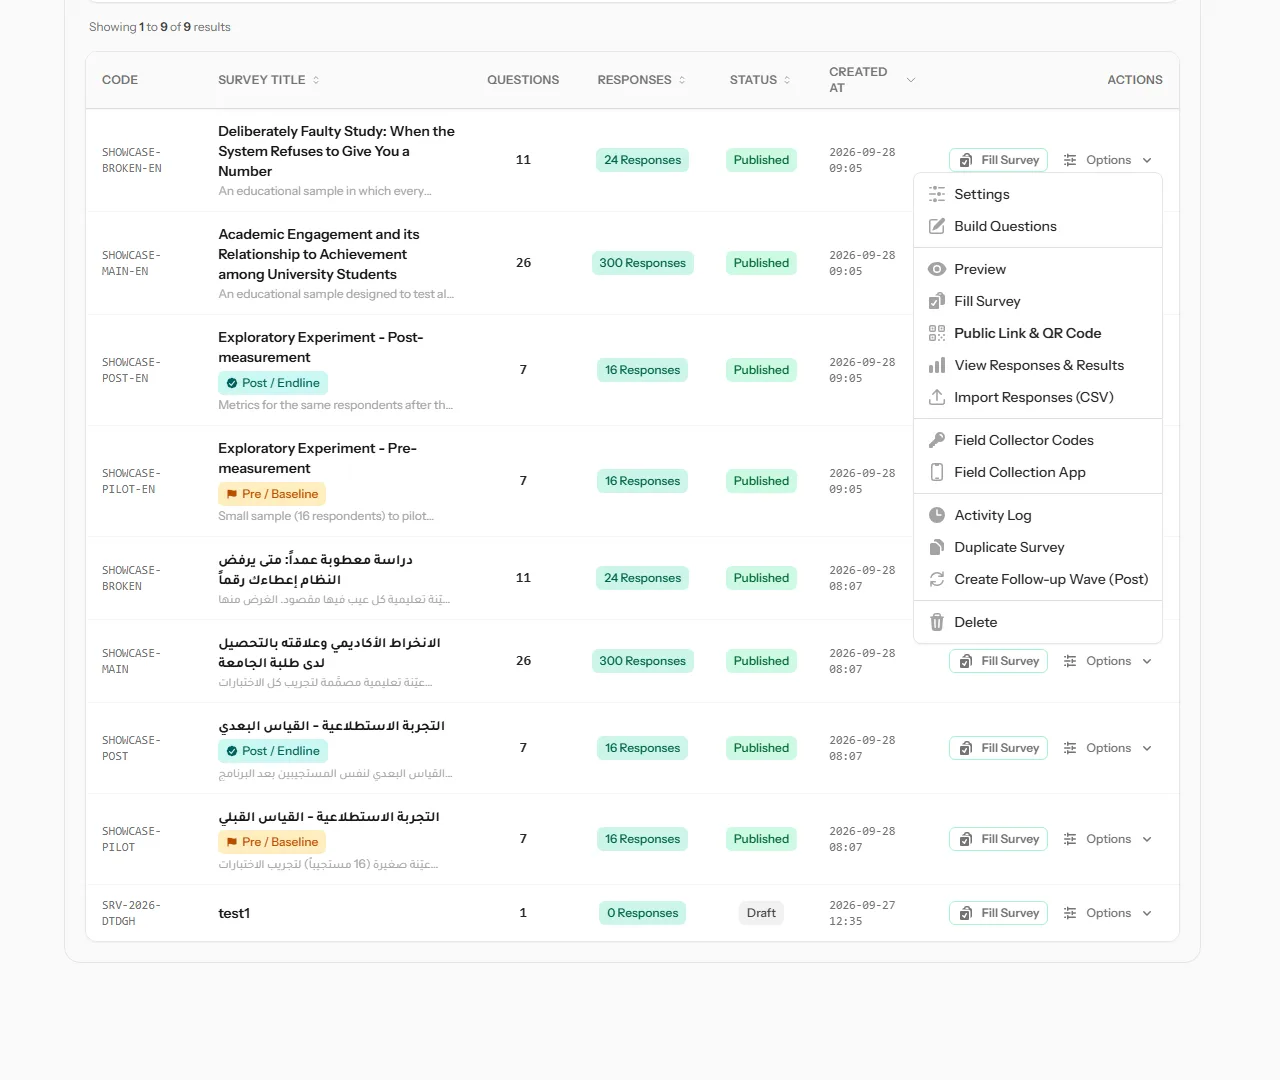 Create Follow-up Wave (Post) is near the bottom of the survey's Options menu.
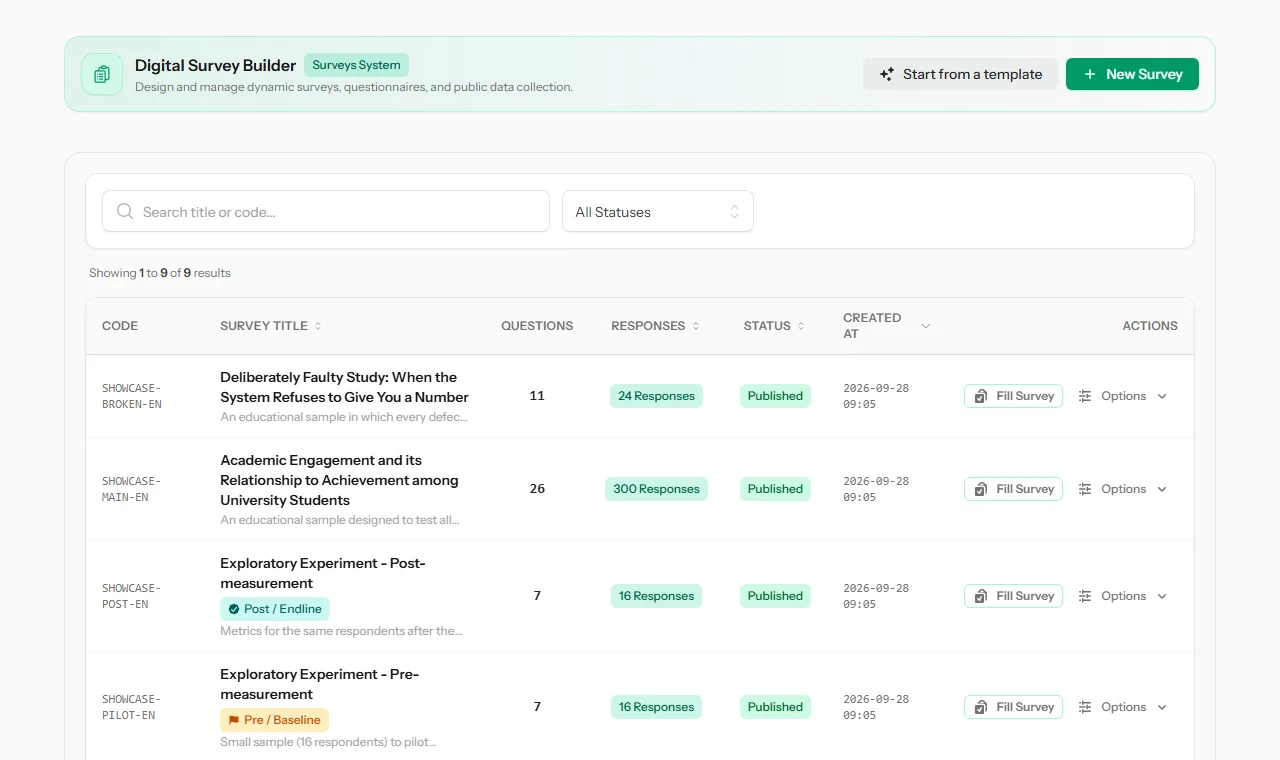
A copy is created, titled "… — Post / Endline". The list now shows Pre / Baseline on the original, and Post / Endline on the copy.
3. Match the same people with a respondent code
To compare each person with themselves, both of their answers need the same respondent code, for example a student number or a code you give each participant.
- On the public link of an academic survey, respondents see Respondent Code (Optional) from the very first response, so the pre survey collects codes before the post wave exists. It tells them their name is never recorded.
- In the Collect app, collectors fill in Respondent Code (Optional).
- In imported files, fill in the respondent code column.
Tip Give every participant their code before the pre survey, and ask them to keep it. Without matching codes, Pulseform can still compare the two groups, but with a weaker test.
4. Read the results
Open the post survey's results.
Pre / Post Hypothesis Test (academic surveys), on the Academic & Reliability tab:
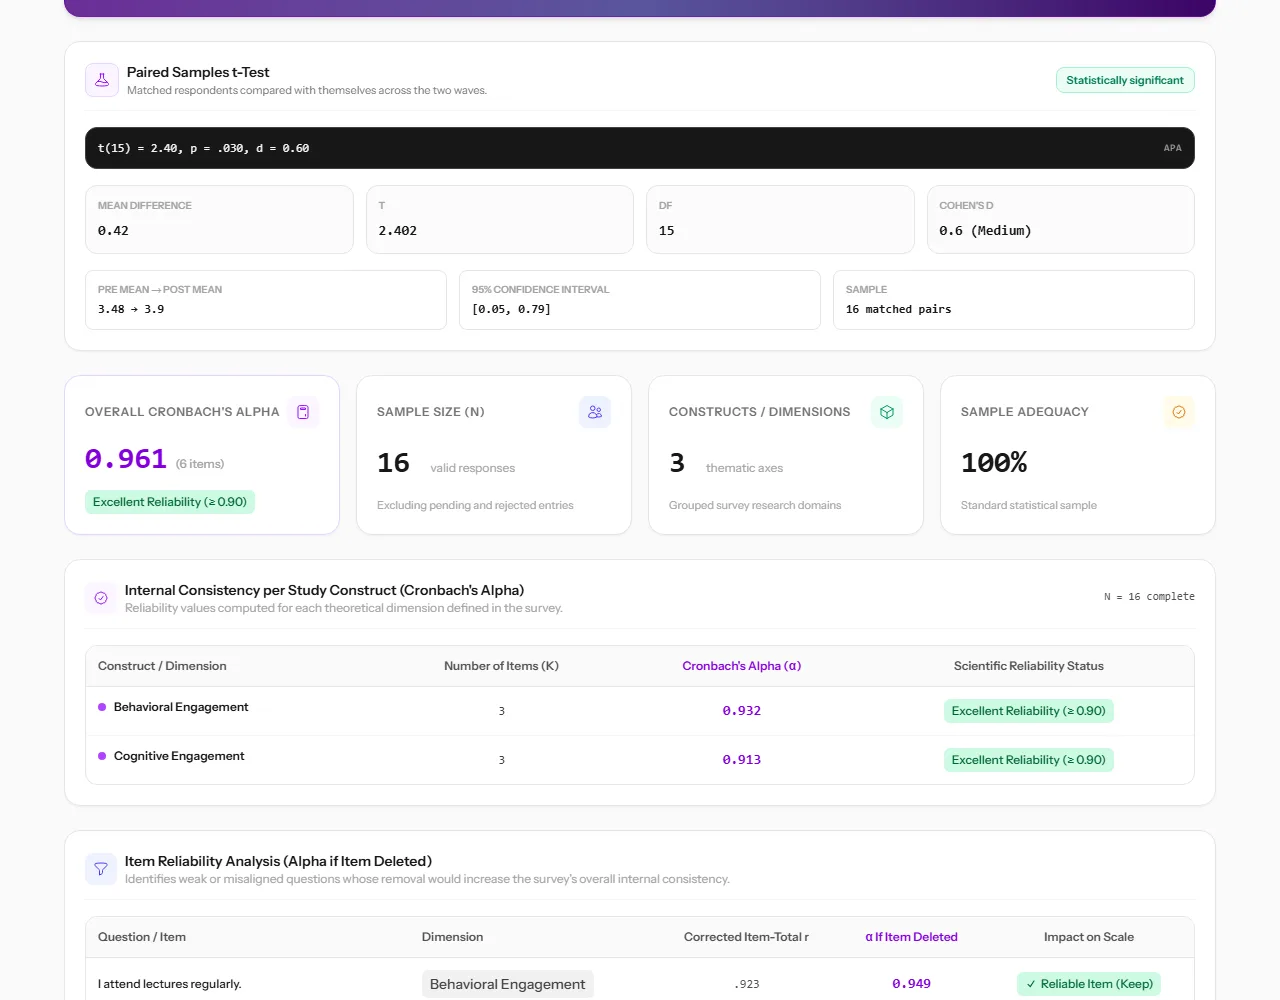 16 participants matched by code: t(15) = 2.40, p = .030, d = 0.60, a statistically significant improvement.
- With matched codes, a paired-samples t-test compares each person with themselves.
- Without them, an independent-samples t-test compares the two waves as separate groups, and says so.
- You get the mean before, the mean after, the difference with its 95% confidence interval, Cohen's d for the size of the effect, and a clear verdict: significant or not.
Pre / Post Comparison (every survey purpose), on the Analytics & Trends tab:
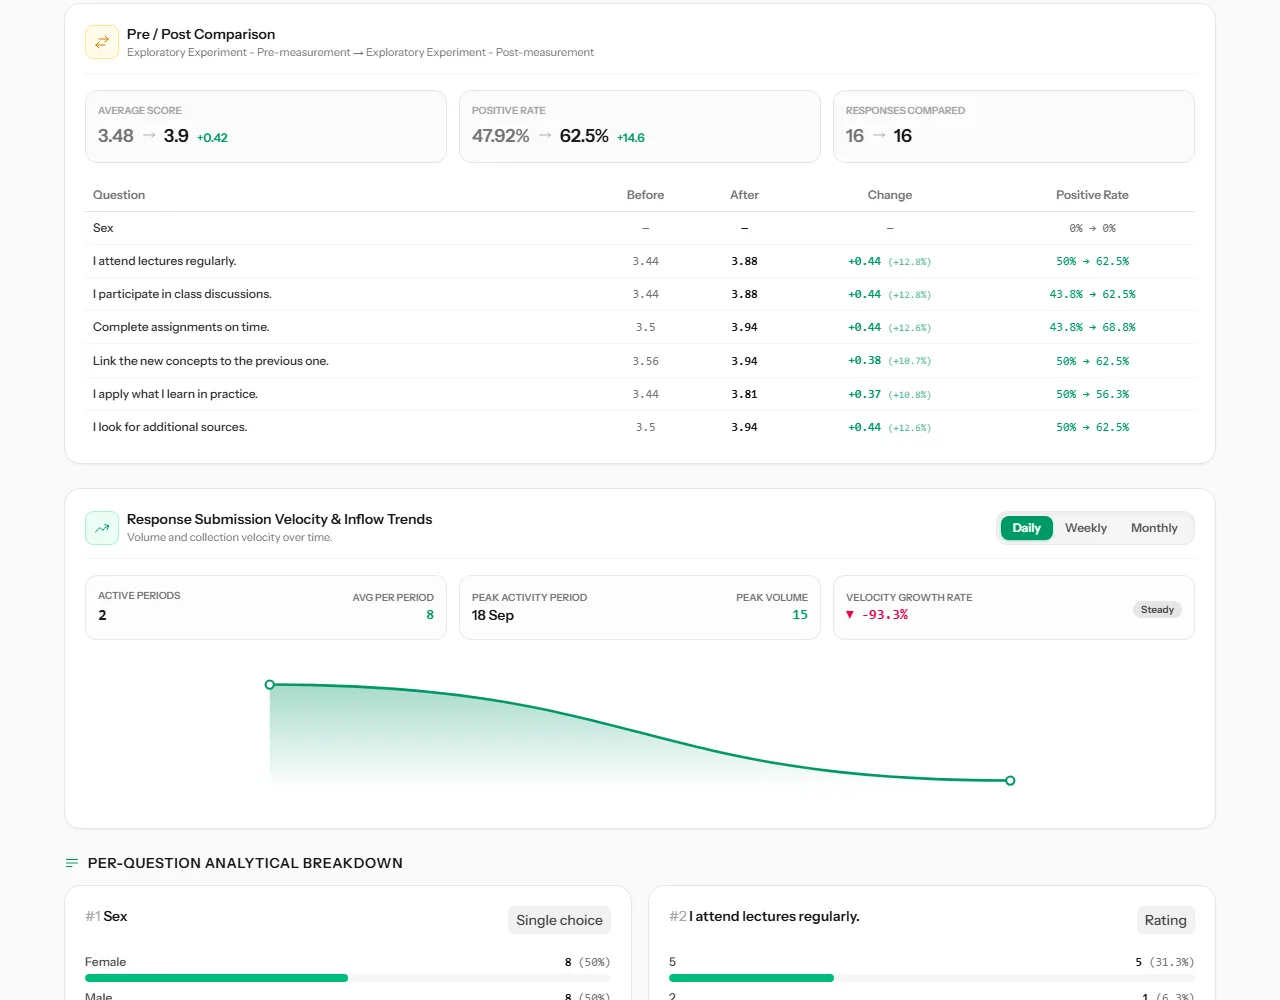 Average score and positive rate before and after, and the change for every question.
It shows the average score and positive rate before and after, how many responses were compared, and a table of every question with its before, after and change.
Why the paired test matters
People differ a lot from one another. A paired test looks at each person's own change, so those differences don't hide the effect of the program. In the example above, everyone improved by about half a point. The paired test detects it clearly, while comparing the two waves as unrelated groups could easily miss it.